The Hospitality Markets Nobody Is Talking About, But Should Be
For years, hospitality investment has been dominated by a familiar list of markets. New York. Los Angeles. Miami. Nashville. Austin. Las Vegas.
These destinations continue to attract travelers, investors, and developers, but they are increasingly competitive, expensive, and saturated.
The next wave of hospitality opportunities is emerging elsewhere.
Across the country, a growing number of secondary and tertiary markets are quietly outperforming expectations as travelers seek authentic experiences, businesses expand into new regions, and local economies diversify. While major cities continue to receive most of the attention, some of the strongest long-term hospitality opportunities may be found in places that rarely make national headlines.
For developers and investors willing to look beyond traditional gateway cities, the opportunity is significant.
The Shift Away from Traditional Hospitality Hubs
The hospitality industry has undergone a major transformation over the past several years. Travelers increasingly prioritize experiences over destinations. Remote work has expanded travel flexibility. Population growth has accelerated across many secondary markets, particularly throughout the Sun Belt.
At the same time, rising land costs, labor challenges, and development expenses in major metropolitan areas have made secondary markets increasingly attractive to investors.
According to PwC’s 2026 hospitality outlook, leisure travel demand is increasingly concentrated in warmer-weather and secondary markets, with demand growth expected to outpace new supply growth in the lodging sector. RevPAR (Revenue Per Available Room), one of hospitality’s key performance indicators, is projected to grow 2.9% in 2026 as demand continues to broaden beyond traditional urban centers.
The trend is clear: travelers are expanding their horizons, and developers should be doing the same.
The Rise of Lifestyle Destinations
One of the most overlooked opportunities today is the growth of smaller, lifestyle-oriented destinations. These are not necessarily major tourism hubs. Instead, they are communities with strong local identity, outdoor recreation, walkable downtowns, culinary scenes, wineries, cultural attractions, or unique natural assets.
Travelers increasingly want authentic experiences rather than manufactured ones. They are seeking places that offer character, connection, and a sense of discovery.
This shift has fueled demand for boutique hotels and experience-driven hospitality concepts. The global boutique hotel market reached approximately $28.5 billion in 2025 and is projected to exceed $50 billion by 2033. Leisure travelers account for more than 70% of boutique hotel demand, reflecting a growing preference for unique accommodations over standardized lodging. For developers, this creates opportunities in markets that may have previously been overlooked by institutional capital.
Secondary Markets Are Becoming Primary Opportunities
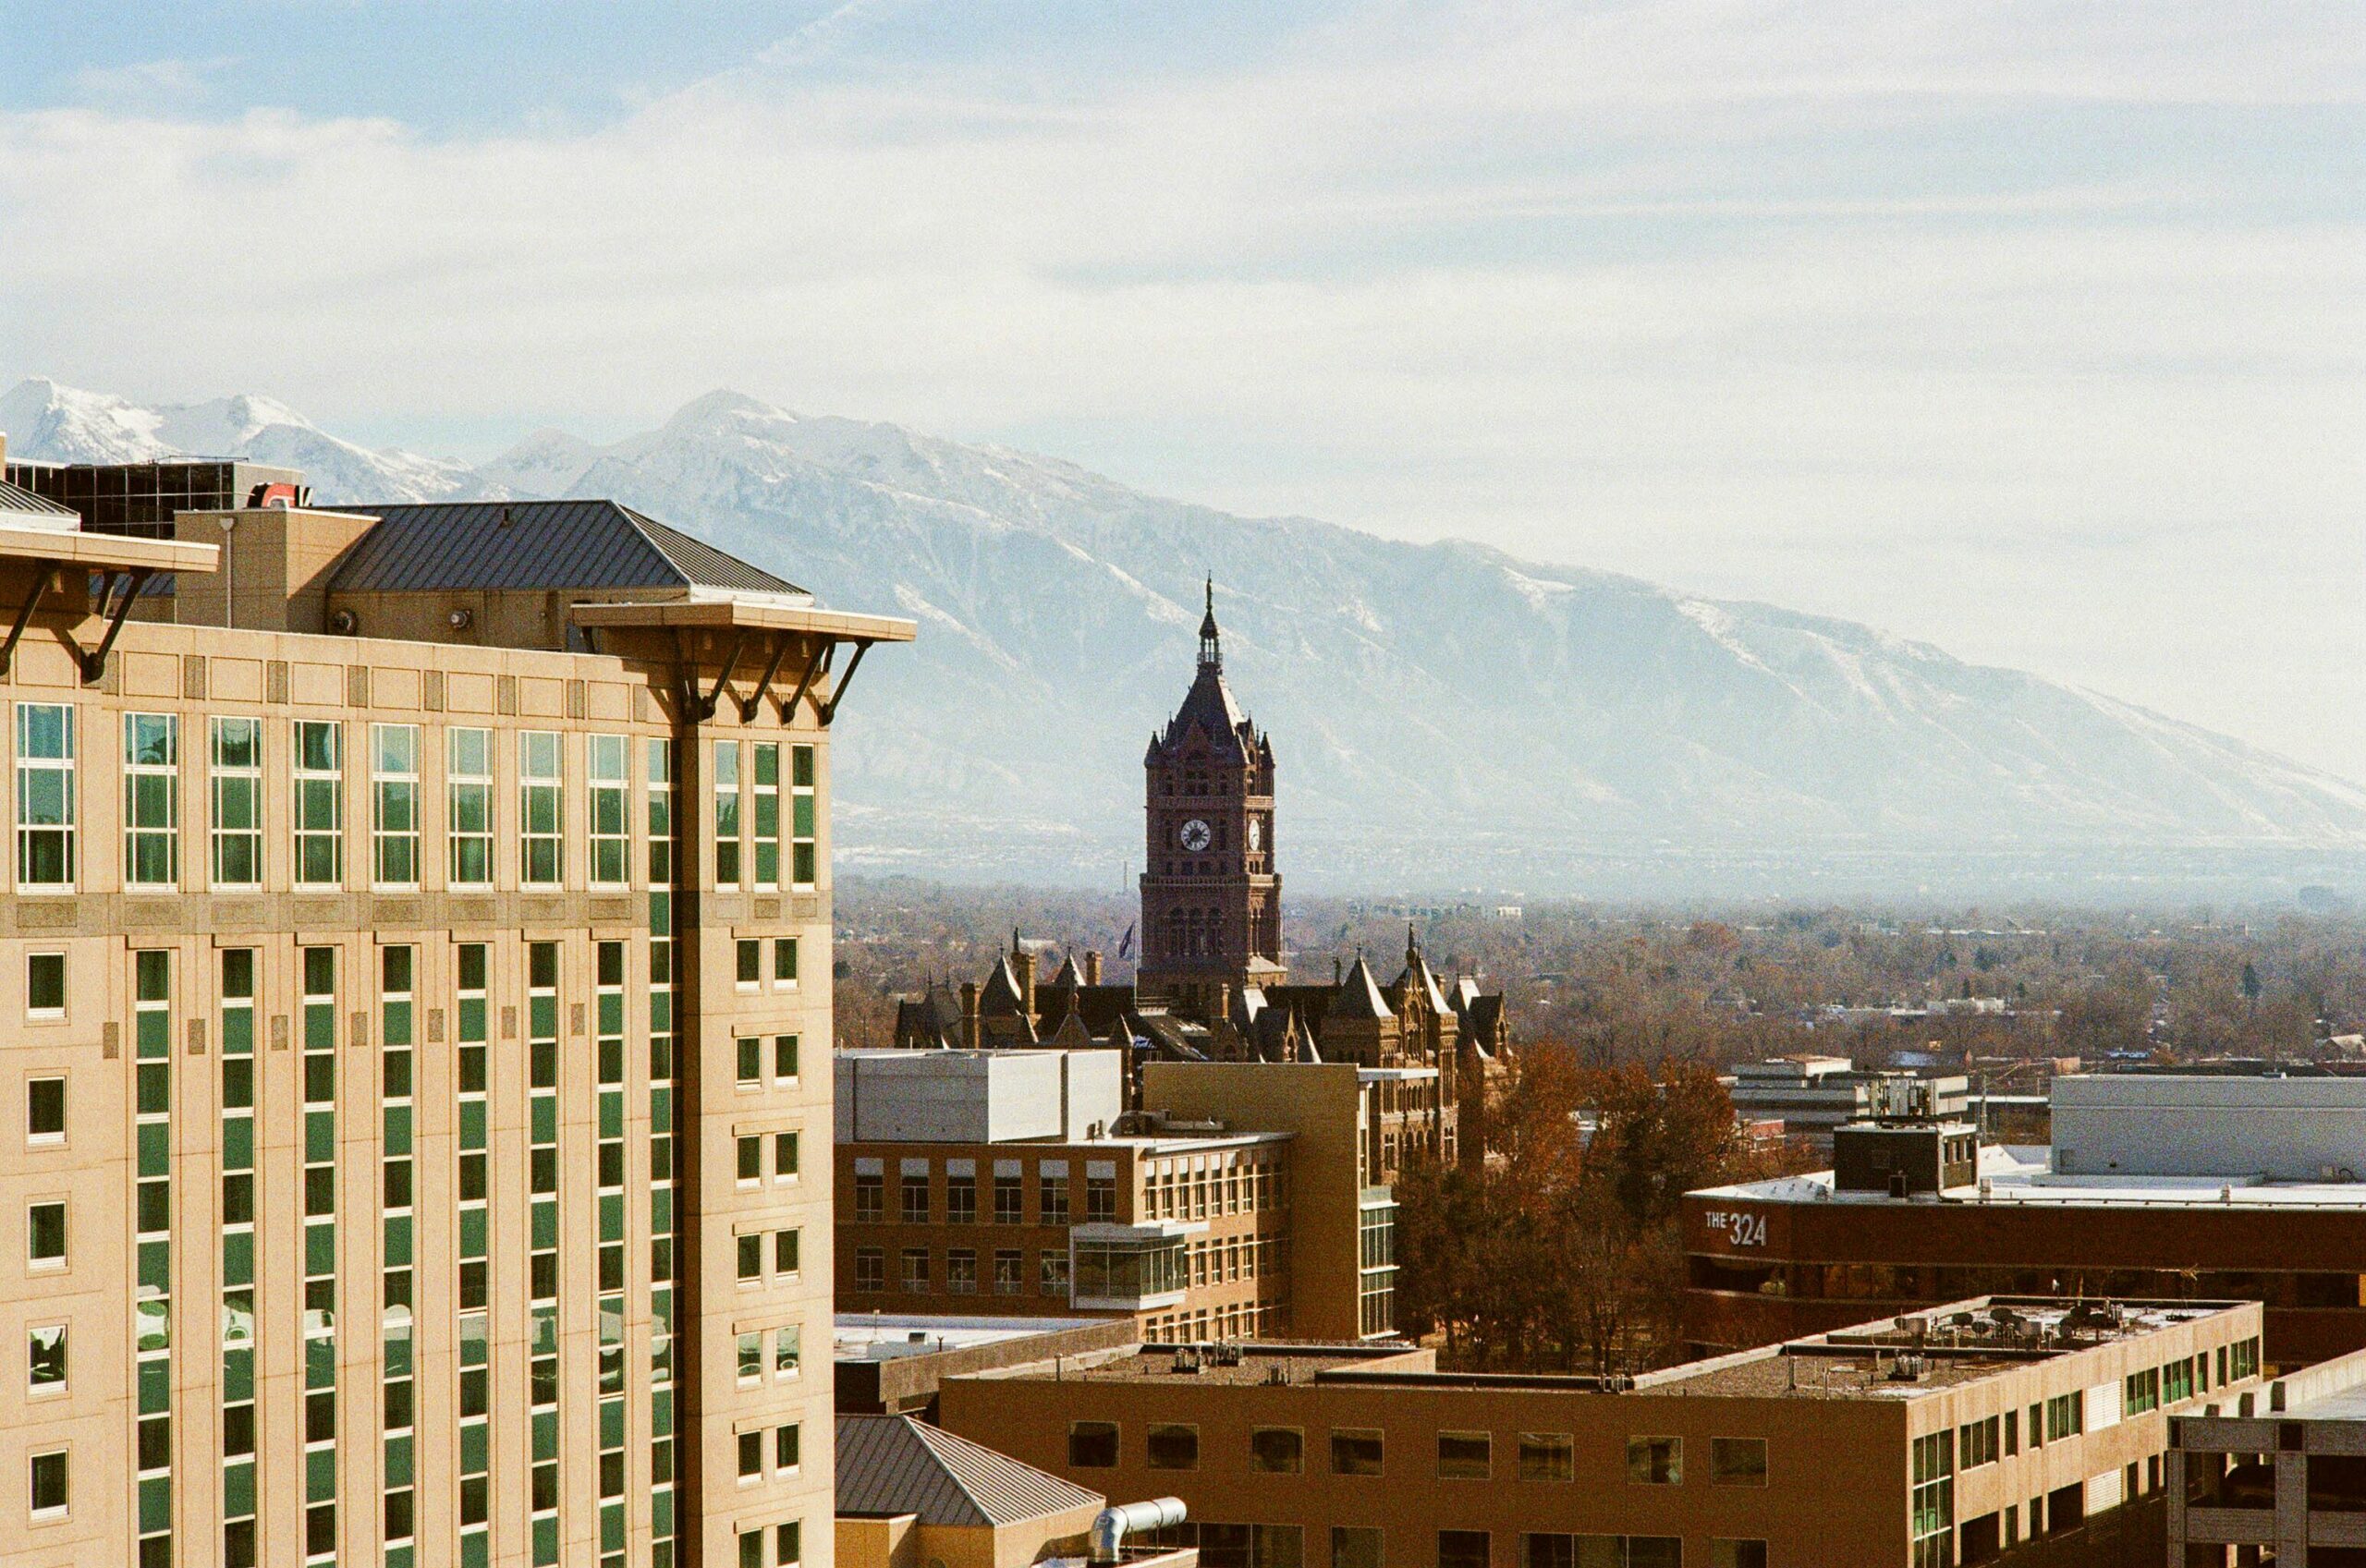
Population migration patterns are creating entirely new hospitality demand centers. Cities across Texas, Idaho, Montana, Utah, Tennessee, Arizona, and the Carolinas have seen significant population growth over the past decade. Businesses have followed. So have conferences, sporting events, healthcare investments, and tourism infrastructure.
As a result, many secondary markets now support hospitality demand levels that would have been hard to imagine just a few years ago.
Industry observers note that investors are increasingly targeting secondary and tertiary markets because of population growth, economic diversification, and lower barriers to entry than in primary gateway cities. These markets often offer stronger development economics and greater upside potential for long-term investors.
The opportunity is not simply building hotels where people live.
It is creating destinations where people want to stay.
Convention and Event Markets Are Quietly Winning
Another underappreciated hospitality segment is the emerging convention and events markets.
While major convention cities remain important, a growing number of mid-sized markets are successfully attracting meetings, conferences, sporting events, and regional gatherings.
These events create year-round occupancy drivers that help reduce seasonality and stabilize hotel performance.
Recent industry data highlight strong convention-driven hospitality growth in markets such as Louisville and St. Louis, where meeting and event activity has significantly boosted hotel demand and occupancy. In downtown St. Louis, occupancy increased by more than 8% year-over-year, while RevPAR grew by more than 9%, outperforming national trends.
Developers who understand the relationship between event infrastructure and hospitality demand may find opportunities where others see only secondary cities.
Outdoor Recreation and Wellness Destinations
One of the strongest trends shaping hospitality today is the convergence of wellness, recreation, and travel.
Travelers increasingly prioritize outdoor experiences, wellness-focused getaways, and destinations that offer meaningful escapes from urban environments.
This trend is creating opportunities across mountain communities, lake destinations, wine regions, coastal towns, and outdoor recreation hubs.
Luxury hospitality brands are investing heavily in wellness-oriented experiences, while boutique operators continue to capitalize on travelers seeking immersive, personalized stays. Industry research shows that experiential travel and wellness-focused hospitality remain among the sector’s fastest-growing segments.
For developers, this often means looking beyond traditional tourism metrics and focusing on lifestyle demand drivers.
Why Timing Matters
Perhaps the biggest reason these markets deserve attention is timing.
Competition remains significantly lower than in major hospitality hubs. Land costs are often more manageable, and development pipelines are less crowded. Local governments are frequently more supportive of investment and economic development initiatives.
Meanwhile, hotel investment activity continues to strengthen. U.S. hotel transaction volume reached approximately $24 billion in 2025, a 17.5% increase year-over-year, as investors returned to the hospitality sector.
The window to establish a presence in many emerging hospitality markets may not remain open indefinitely.
Looking Ahead
The future of hospitality development will not be defined solely by the largest cities.
It will be shaped by communities that offer authenticity, lifestyle appeal, economic growth, and unique experiences travelers can’t find elsewhere.
The markets attracting the most attention today may not necessarily offer the best opportunities tomorrow.
For developers willing to think differently, some of the most compelling hospitality investments may be hiding in plain sight.
The smartest hospitality strategy isn’t always to follow the crowd.
Sometimes it’s finding the markets nobody is talking about—before everyone else starts talking about them.